- Financial Analysis
- Commercial Analysis
- Operations Analysis
- Multi-Entity Analysis
Financial Analysis
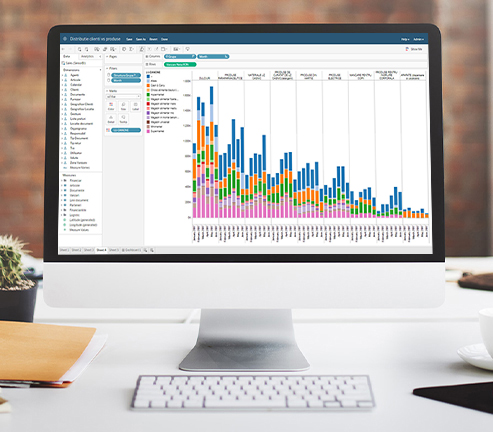
SeniorVisualBI delivers a clear, up-to-date view of financial performance. Accounting and operational data are automatically transformed into relevant reports, eliminating manual processing and delays.
Instantly create reports on:
Instantly create reports on:
- Revenue and expense trends by period, cost center, or line of business
- Gross and net margin analysis by products, services, or customers
- Key financial indicators: cash flow, gross/net profit, EBITDA, operational costs
- Budget vs. forecast vs. actual comparisons, with variance analysis
- Financial trends, cost deviations, and their impact on profitability
- Liquidity, solvency, and consolidated financial performance analysis
Commercial Analysis
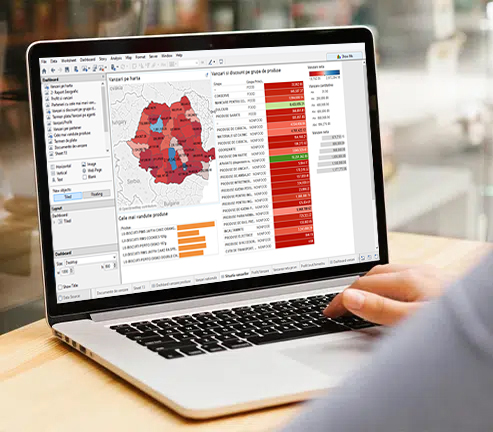
The interactive analytics system enables sales teams to monitor sales performance and customer profitability in real time. The built-in dynamic reports highlight market trends and the effectiveness of sales strategies.
Analyze in detail:
Analyze in detail:
- Top products, customers, and market segments, with period-over-period comparisons
- Trends in sales volumes, margins, and applied discounts
- Performance of sales teams, representatives, and distribution channels
- Geographic analysis - sales by region, location, or branch
- Key metrics such as conversion rate, average order value, and customer acquisition cost
- Profitability analysis by customer, product, or commercial category
Operations Analysis
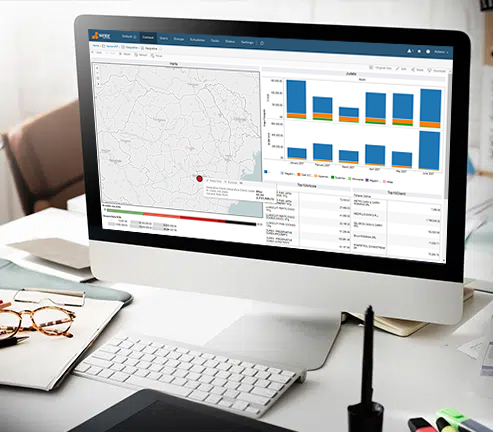
The Business Intelligence solution provides full visibility into production and logistics processes, helping managers quickly identify bottlenecks and areas with optimization potential.
Monitor and analyze:
Monitor and analyze:
- Efficiency indicators (OEE, unit costs, cycle times, losses)
- Production line performance and equipment utilization rates
- Operator efficiency and productivity by shift or work order
- Bottlenecks in production or distribution flows and their root causes
- Correlation between production costs, delivery performance, and execution timelines
- Inventory analysis, material turnover, and replenishment lead times
- Deviations between planning and execution, tracked in real time
Multi-Entity Analysis
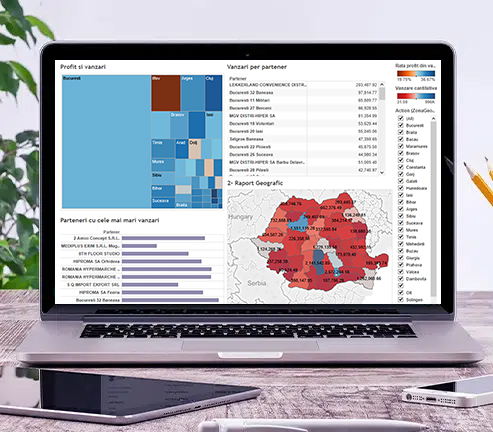
SeniorVisualBI simplifies group-level reporting by automatically consolidating data across all companies and divisions. The platform provides a unified view with full traceability down to individual transactions.
Gain a consolidated perspective through:
Gain a consolidated perspective through:
- Analysis of revenues, costs, and profitability at group or divisional level
- Centralized visibility across all entities, with drill-down to branch or transaction level
- Reporting aligned with IFRS, US GAAP, or local chart of accounts standards
- Intercompany transaction elimination and automatic generation of consolidated statements
- Performance comparisons across entities, countries, or lines of business
- Integration across multiple currencies, accounting standards, and financial models